Figure 3.
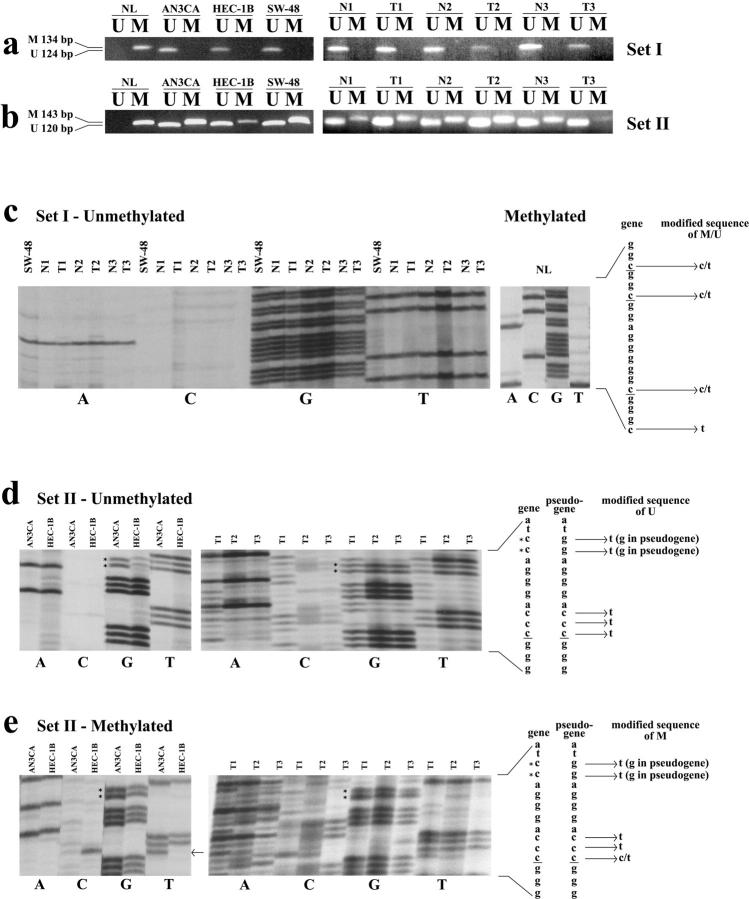
MSP and sodium bisulfite sequencing for set I and II primers. a and b: MSP results for PTEN primer sets I and II respectively. Panels on the left show results for cell lines while those on the right are representative of matched normal (N) and tumor (T) samples. PTEN set I sodium bisulfite sequencing of unmethylated cell lines and matched normal and tumors, and methylated NL is shown (c). Sequencing of unmethylated (d) and methylated (e) cell lines and tumors using set II primers are shown. PTEN and pseudogene sequences are shown with critical differences between the 2 sequences identified with an * and differences between the genomic and sodium bisulfite modified DNA are indicated. Note the presence of a T instead of a C (arrow) in the AN3CA cell line indicating that this C of a CpG dinucleotide is not methylated, unlike in HEC-1B (e). Cytosine residues of CpG dinucleotides are underlined. U, unmethylated; M, methylated; NL, normal lymphocyte DNA.

