
Figure 8.
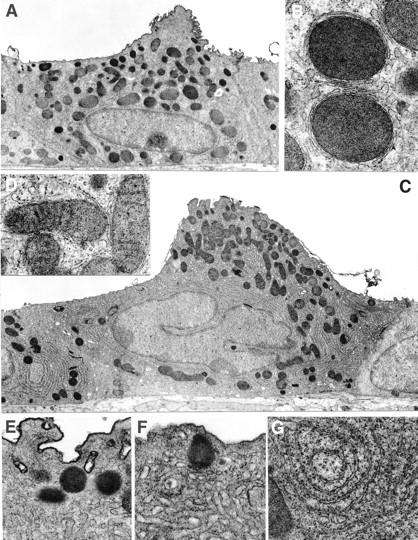
Comparison of Clara cell ultrastructure in carrier-treated mice (A, B, E) with Clara cells of mice treated with NA (200 mg/kg) for 21 days (C, D, F, G). In Clara cells of tolerant mice, the overall size increased (A, C) and there was an increase in SER, RER (E–G), and small mitochondria with cristae (D) with a reduction in large mitochondria without cristae (B). Scale bars: A, 1 μm; B, 0.25 μm; C, 1 μm; D, 0.25 μm; E, 0.25 μm; F, 0.25 μm; G, 0.25 μm.