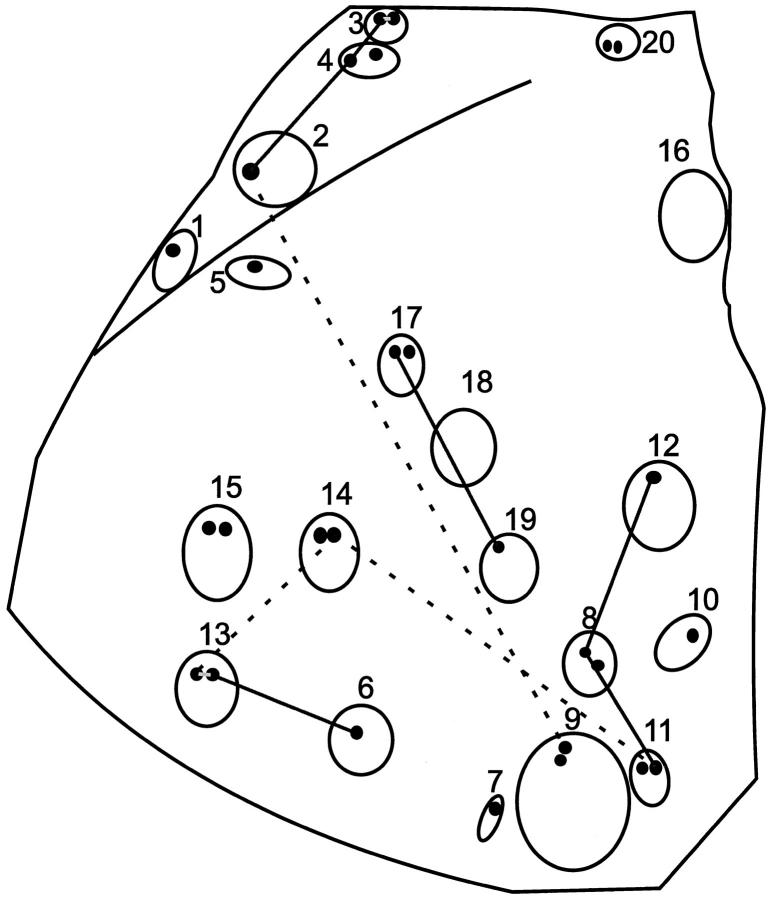
Figure 5.
A schematic drawing of the unstained tissue section of FL 8-‘83. The open circles represent the numbered follicles from which samples (smaller closed circles) were taken. Labeling of samples with letters was done from left to right, from top to bottom. Follicles in which IgM- or IgG-expressing subclones with identical mutation patterns were found are connected by solid and dashed lines respectively.

