
Figure 2.
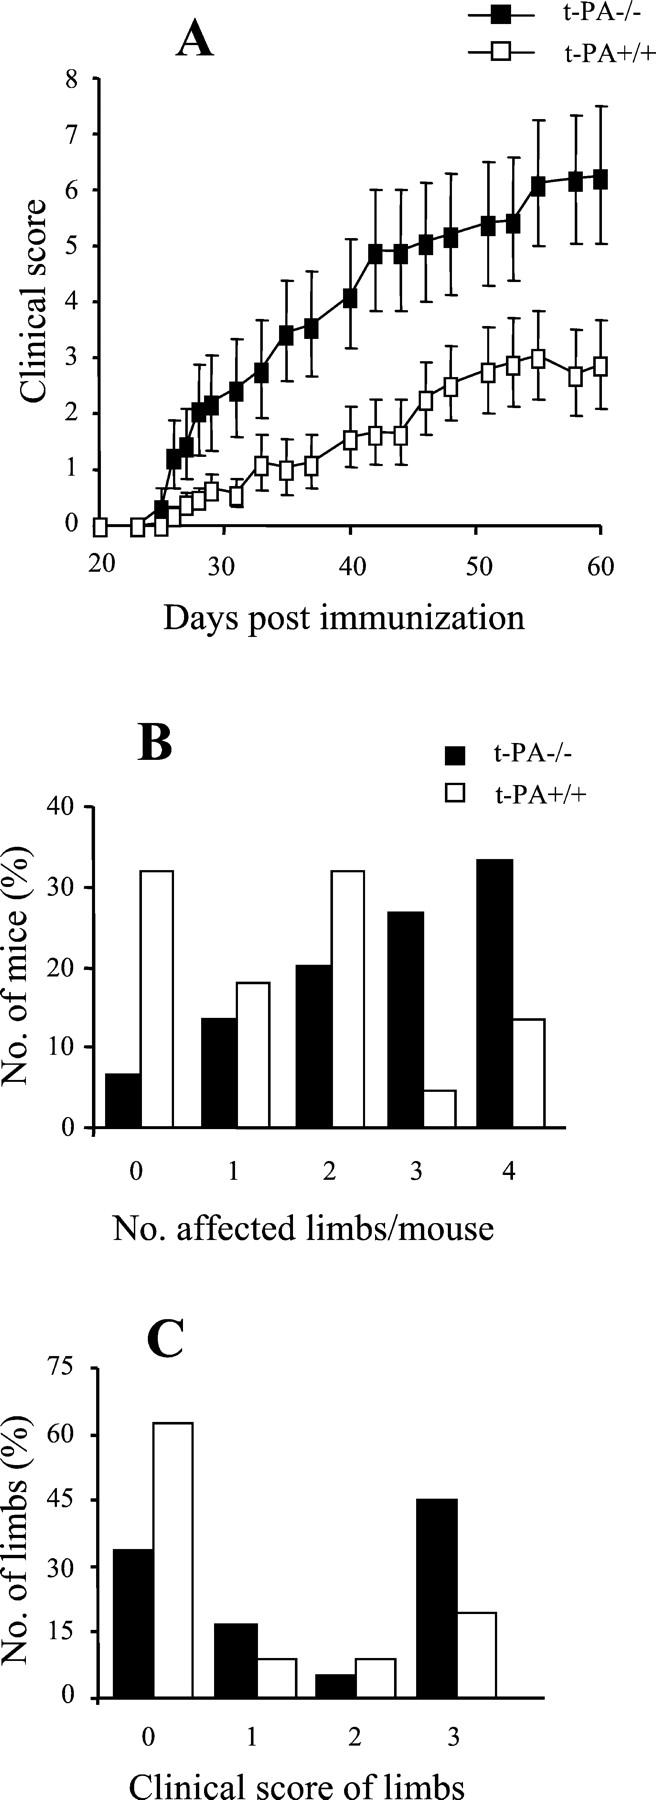
CIA development in t-PA−/− mice and control t-PA+/+ mice. A: Severity. Results are expressed as the mean clinical score ± SEM. There is significantly more severe disease in the t-PA−/− mice (n = 15) compared with the t-PA+/+ mice (n = 22) (P = 0.015, Mann-Whitney using the mean clinical score of individual mice averaged throughout days 21 to 60). B: The number (%) of mice that developed arthritis in a given number of limbs is presented. C: The number (%) of individual limbs with a particular clinical score is shown. For t-PA−/− mice, there are significantly more limbs with a clinical score of 3 compared with t-PA+/+ mice (P < 0.001, multi-way chi-square).