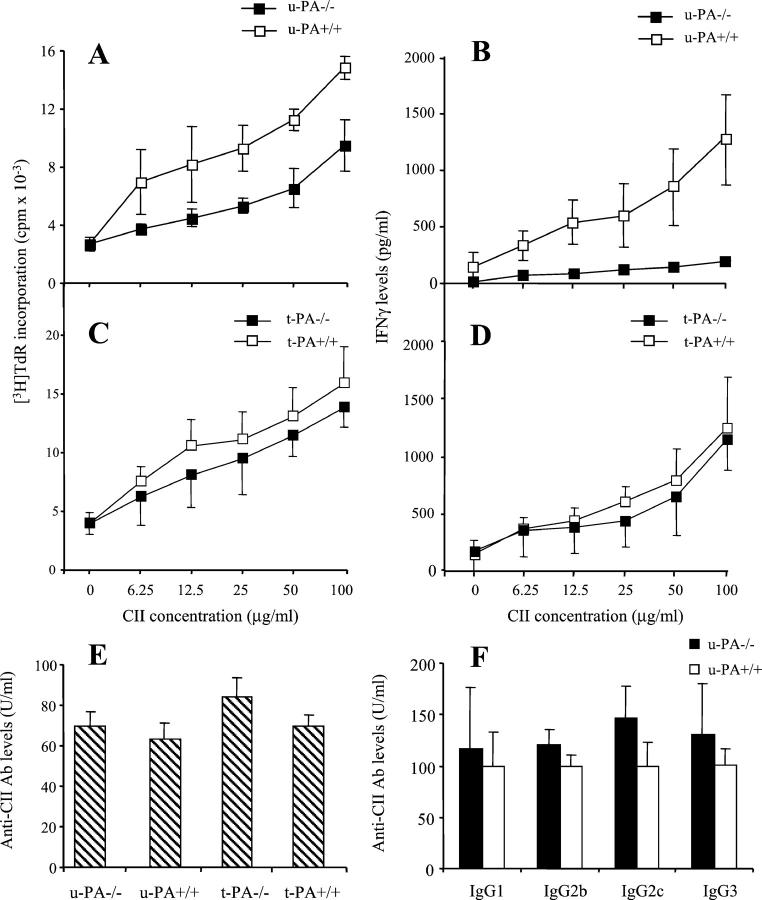
Figure 5.
Effect of u-PA and t-PA deficiency on CII-specific immune responses in CIA. A: Cellular response to CII in u-PA−/− or u-PA+/+ mice. B: IFN-γ levels from the CII-specific T-cell culture supernatants described in A. C: Cellular response to CII in t-PA−/− or t-PA+/+ mice. D: IFN-γ levels from the CII-specific T-cell culture supernatants described in C. Inguinal lymph node cells from pools of three mice immunized for CIA were cultured in the presence of differing concentrations (0 to 100 μg/ml) of denatured CII for 72 hours. Cultures were pulsed with tritiated thymidine ([3H]TdR) for the last 16 hours (see Materials and Methods). Results are expressed as the amount of [3H]TdR incorporation (mean ± SEM) in cpm (A and C). Cells from u-PA−/− mice showed significantly less [3H]TdR incorporation than those of u-PA+/+ mice at all CII concentrations (P = 0.034). IFN-γ levels were measured by ELISA and are expressed as the mean ± SEM (pg/ml) (B and D). Cells from u-PA−/− mice produced significantly less IFN-γ than those from u-PA+/+ mice at all CII concentrations (P = 0.030). E: IgG antibody response to CII measured at the end of each experiment (day 60). Results are expressed as the mean ± SEM. F: IgG1, IgG2b, IgG2c, and IgG3 antibody response to CII in sera from u-PA+/+ and u-PA−/− mice. Results are expressed as the mean ± SEM, where the mean level of antibody for each IgG subclass was standardized such that u-PA+/+ mice had a mean level of 100 U/ml.

