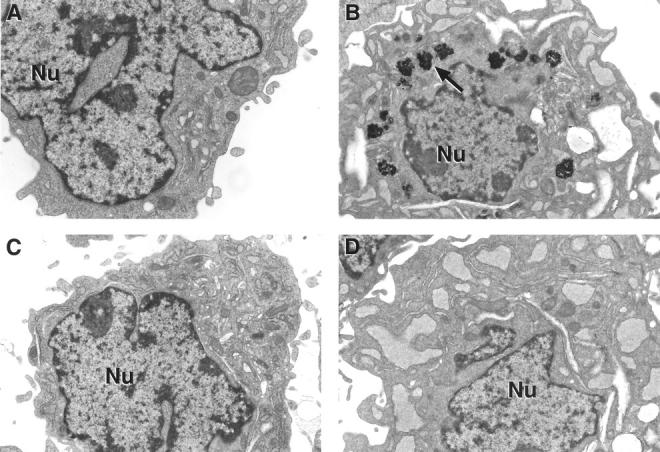
Figure 4.

Lead-induced inclusion bodies as detected by EM. MT-null and WT cells were treated with lead for 48 hours; after fixation and staining they were viewed by EM (original magnification, ×15,000; scale bar, 1 μm). A: Control WT cells. B: Lead-treated WT cells with groups of irregularly shaped inclusion bodies around the nucleus present in the cytoplasm. C: Control MT-null cells. D: Lead-treated MT-null cells (note absence of inclusion bodies).
