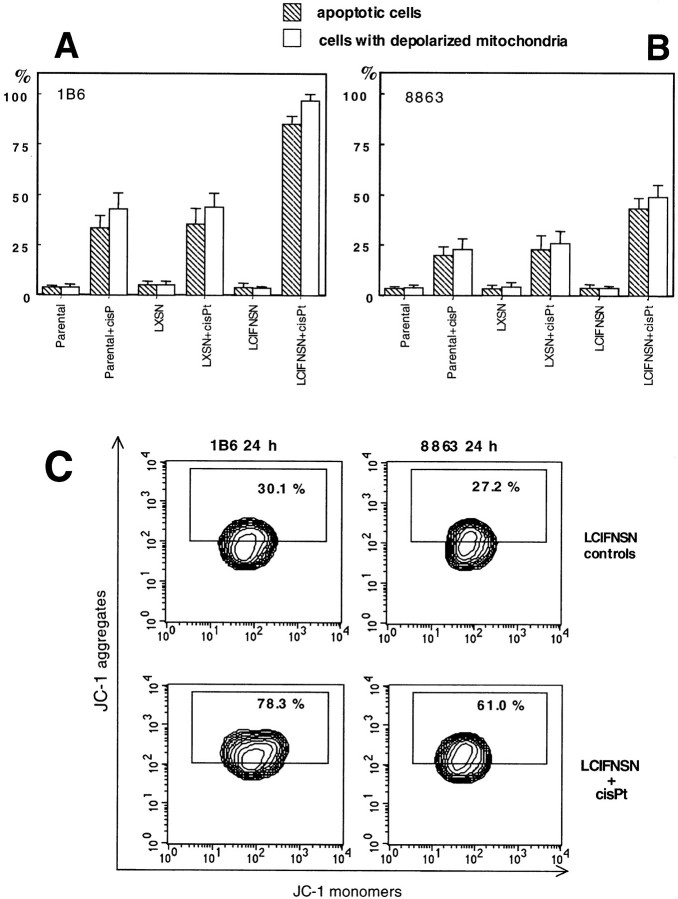
Figure 1.
Quantitative and qualitative analysis of mitochondrial membrane potential during cisPt-induced apoptosis. A and B: Cytofluorimetric quantitative evaluation of 1B6 (A) and 8863 (B) apoptotic cells as assessed by TUNEL reaction (hatched columns) and cells with depolarized mitochondria (open columns) as assessed by using JC-1 probe. C: Qualitative and quantitative cytofluorimetric analyses of mitochondrial membrane potential in both LCIFNSN (CIFN-producing) 1B6 (left) and 8863 (right) cells before and after 24 hours of cisPt treatment. Boxed areas in C indicate the percentage of cells that express high red fluorescence (corresponding to J-aggregates that typically increase when mitochondrial membrane becomes more polarized). A representative experiment of four is reported.

