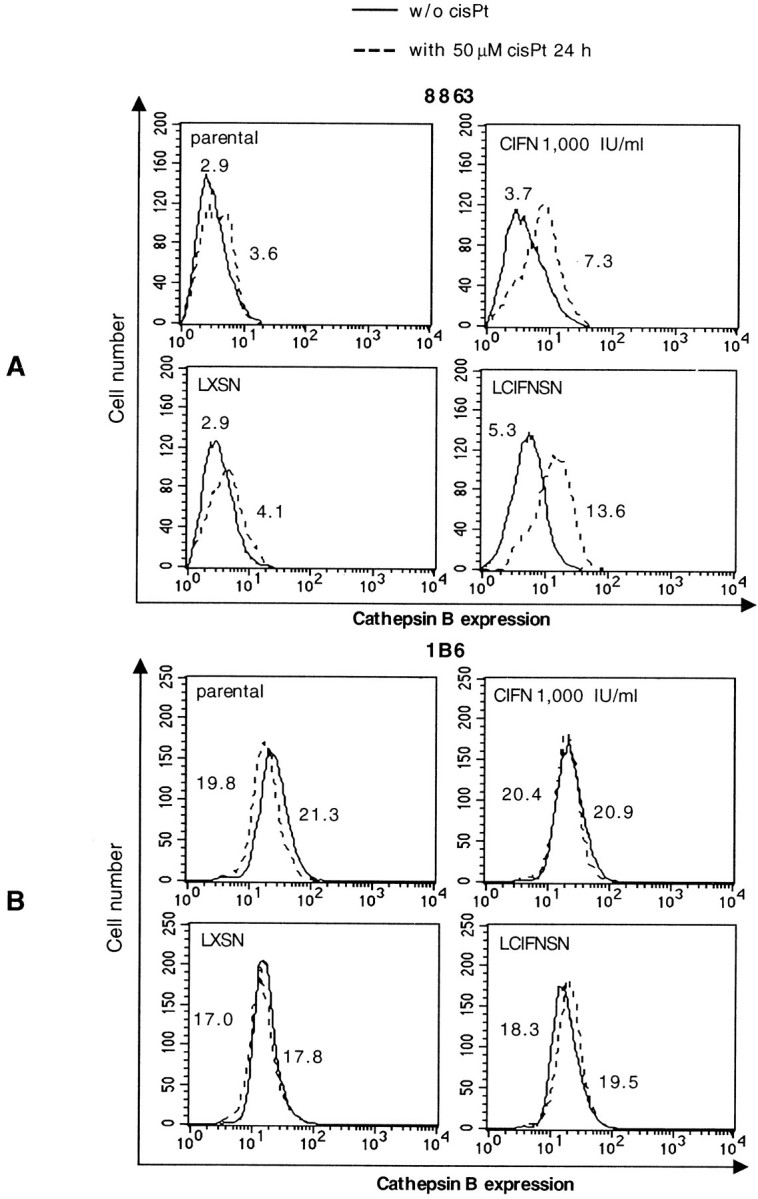
Figure 6.

Cathepsin B expression analyses. Cathepsin B expression, as measured by cytofluorimetric analysis in 8863 (A) and 1B6 (B) cell lines in the presence (dotted line) or absence (solid line) of cisPt. Numbers represent the median values of fluorescence histograms. One experiment representative of four is shown.
