
Figure 3.
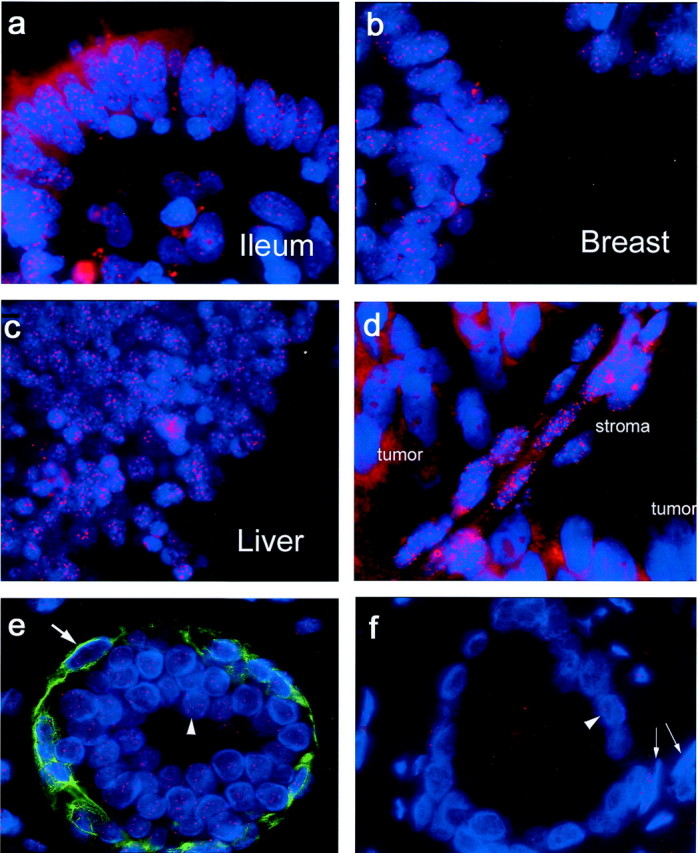
TEL-FISH on normal human tissues (human multitissue array), human prostate xenograft tumor, and matched normal:tumor prostate tissue from the same gland. a–c: Telomeres are visualized by hybridization of fluorescently labeled (Cy3) peptide nucleic acid probe and are seen as bright red spots in these sections from standard formalin-fixed, paraffin-embedded normal human tissues (blue, DAPI; oil; original magnifications, ×100). d: PC-82 human prostate tumor xenograft growing in a nude mouse. e and f: Representative image of normal and tumor human prostate acini using a combination of TEL-FISH and immunofluorescence. Basal cells in the normal tissue are clearly distinguished by their basal cell-specific cytokeratin positivity. Red, telomere-specific Cy3-labeled PNA probe; green, 34βE12 anti-cytokeratin antibody; blue, DAPI. Oil; original magnifications, ×1000. e: Large arrow, a normal basal cell; arrowhead, normal secretory epithelial cell. f: Arrowhead, tumor cell; arrows, normal stromal cells. Tumor telomeres are notably less intense than in the adjacent host stroma.