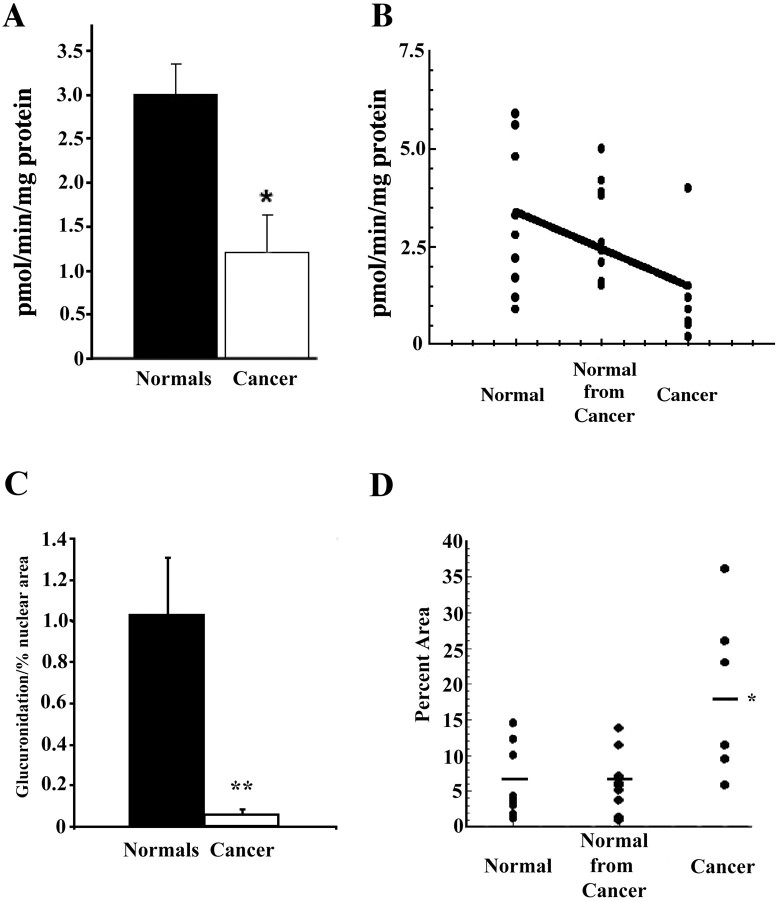
Figure 8.
UDP-glucuronosyltransferase activity of tissue obtained from mammoplasty specimens (normal), and of tissue obtained from mastectomy specimens from sites distant from the cancer (normal from cancer) and from the cancers. Assays were performed on disrupted cryostat sections, as described in Materials and Methods. Statistical significance of differences in glucuronidation of 4-OH-E1 by tissue from the three groups was determined by one-way analysis of variance, followed by Neuman-Keuls t-test. Because values for glucuronosyltransferase activity of normal tissue from mammoplasty and tissues distant from the cancers did not differ significantly from each other, they were pooled. Top (A and B): Enzyme activity normalized for mg protein. Bottom (C): Enzyme activity normalized for mg tissue protein corrected for differences in percent area occupied by cell nuclei. A: Pooled values for tissue from mammoplasty specimens and from tissue distant from the cancer from mastectomy specimens, compared with values for the cancer tissue. Differences were significant at the P < 0.01 level by Student’s t-test. B: Individual values plotted for the three groups. Line indicates finding from simple polynomal linear regression analysis (slope significant at the P < 0.01 level). The single high value in the cancer group was from a patient with extensive, strongly immunopositive in situ lesions. C: UDP-glucuronosyltransferase activity normalized for mg protein corrected for differences in percent area occupied by cell nuclei. The percent area occupied by hematoxylin-stained cell nuclei was estimated in representative sections from the tissue used for the enzyme assays, using computerized image analysis, as described in Materials and Methods. **, Significantly different from histologically normal specimens from mammoplasty and mastectomy specimens combined (P < 0.01 by Student’s t-test). D: Individual values for percentage of area occupied by cell nuclei in representative sections. In histologically normal tissues, these values ranged from 0.93 to 13.8 (mean ± SEM = 6.28 ± 1.1) and in sections from breast cancers from 5.96 to 36.1 (mean ± SEM = 18.7 ± 4.7) and were significantly different from each other (P < 0.01).

