
Figure 1.
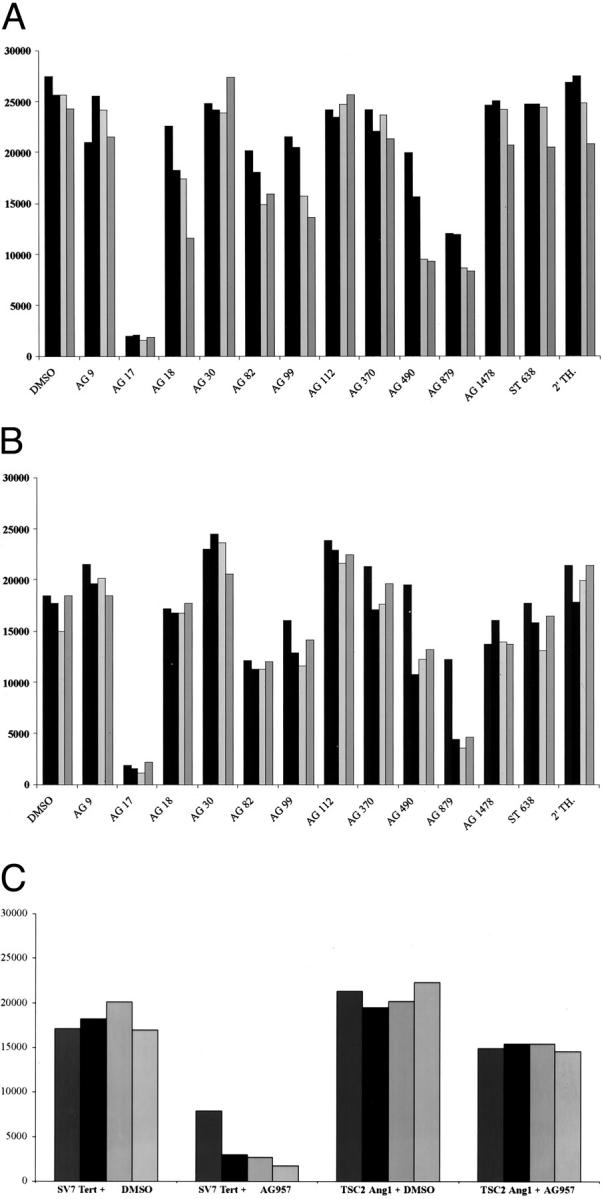
Inhibition of proliferation of SV7 tert and tsc2ang1 cells by tyrosine kinase inhibitors. A: Inhibition of SV7 tert cells using a battery of inhibitors. B: Inhibition of tsc2ang1 cells. C: Inhibition of both cell lines by AG957. The x axis displays the name of the tyrosine kinase inhibitor and the y axis represents the number of cells after 72 hours. Left columns represent concentrations of 5 μg/ml (or equal concentration of dimethyl sulfoxide), second from left columns represent concentrations of 10 μg/ml, second from right columns represent concentrations of 15 μg/ml, and right columns represent concentrations of 20 μg/ml.