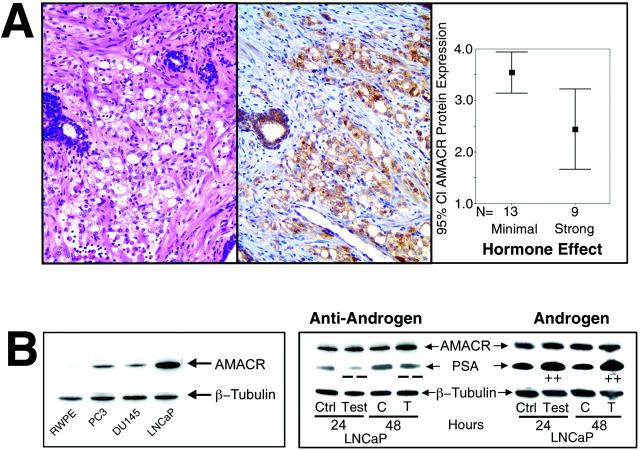
Figure 3.
A: PCa demonstrating strong hormonal effect (right) because of anti-androgen treatment (H&E). Weak AMACR expression (middle) seen in the corresponding immunostained section. Comparison of the mean AMACR expression between PCa demonstrating minimal and strong hormonal effects by H&E examination (right, 95% CI). B: Left: Western blot analysis representing the baseline AMACR expression in different prostate cell lines. Internal loading control with β-tubulin. Right: Western blot analysis of LNCaP cells for AMACR and PSA expression after treatment with an androgen or an anti-androgen for 24 hours and 48 hours. Results of the nontreated control samples (C) and the hormone-treated (T) cells are shown. Original magnification, ×200 (A).

