
Figure 3.
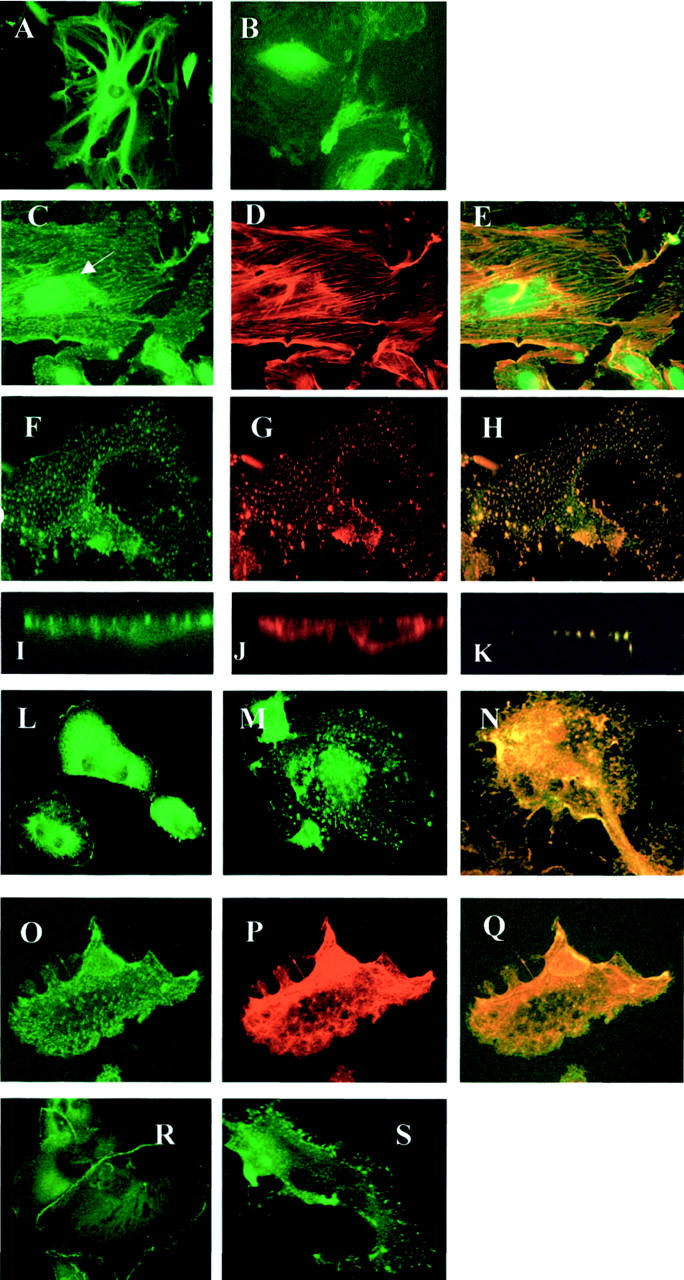
Depolymerization experiments. A–E: Microtubule depolymerization. Microtubule expression in untreated cells (A) and cells treated with colcemid (B). Colcemid-treated cells stained for nephrin (C), actin (D), and merged images (E), showing maintenance of filamentous nephrin and actin staining in cytoplasm, and markedly disrupted nephrin patterning in perinuclear region (arrow). F–S: Actin depolymerization using cytochalasin. Differentiated podocytes, confocal imaging, showing plane sections at the same level. Immunostaining for nephrin (F), actin (G), and merged image (H) shows granular redistribution of both, which co-localizes in the cell cytoplasm. I–K: Cross-sectional confocal images, showing nephrin (I) and actin (J) at cell surface in untreated cell, and actin depolymerized cell (K) double-stained for actin and nephrin, with both colors merged in intracellular granules. L–N: CD2AP cell distribution, cell surface distribution in normal cells (L), changing to granular cytoplasmic location after cytochalasin (M). N: Co-localization of disrupted granular CD2AP (green) with actin (red). O–Q: Podocin disruption by cytochalasin. Granular cytoplasmic redistribution (O), corresponding to nephrin redistribution (P), and demonstrating co-localization on the merged image (Q). ZO-1 cell junction distribution in normal cells (R), and disruption to submembranous location after cytochalasin treatment (S). Original magnifications, × 40 (A–E); ×63 (O to Q).