Figure 3.
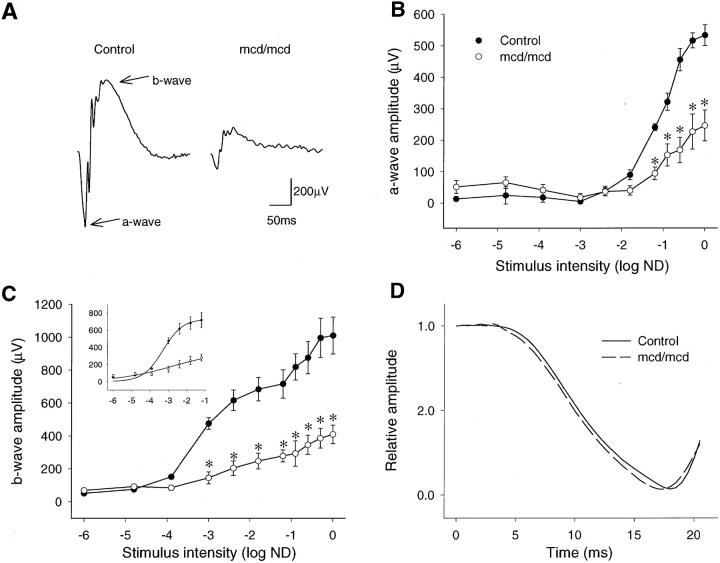
Electroretinographic measurement of retinal function in 12-month-old experimental mcd/mcd and C57BL/6 mice. A: Typical scotopic ERGs recorded from C57BL/6 and mcd/mcd mice. B: Intensity response characteristics of the dark-adapted ERG a-wave amplitude recorded from four C57BL/6 and four mcd/mcd mouse eyes. Data are mean values ±SEM. *, P < 0.001. C: Intensity response characteristics of dark-adapted ERG b-wave amplitude recorded from four C57BL/6 and four mcd/mcd mouse eyes. Data are mean values ±SEM. *, P < 0.002. The inset shows a Naka-Rushton curve fit of the dark-adapted ERG b-wave stimulus-response characteristics. Data are mean values ±SEM, n = 4. R2 = 0.992 (C57BL/6), 0.930 (mcd/mcd). D: The leading edges of the normalized, dark-adapted, ERG a-waves averaged from four C57BL/6 and four mcd/mcd mouse eyes.

