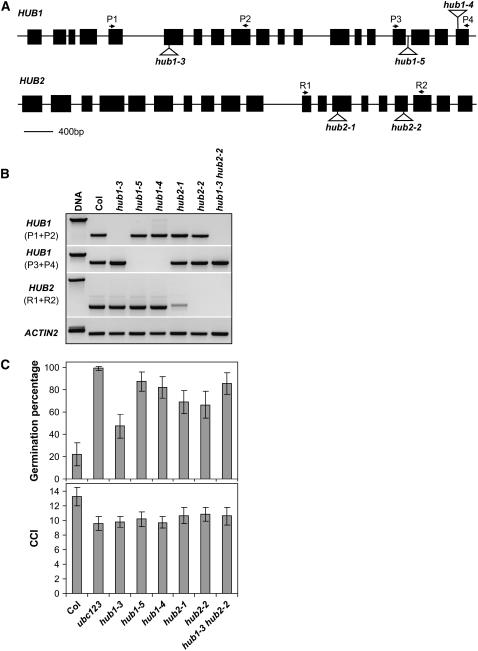
Figure 4.
Characterization of HUB1 and HUB2 T-DNA Insertion Lines.
(A) Schematic illustration of the gene structure of HUB1 and HUB2 with the positions of the T-DNA insertions. The positions of the primers, used for the RT-PCR analysis in (B), are indicated on top of the structures. Exons are shown as black boxes and introns as lines.
(B) RT-PCR analysis of the HUB1 and HUB2 transcripts in leaves of wild-type and T-DNA insertion mutants. Two different primer pairs were used for HUB1. The ACTIN2 gene was used as a loading control.
(C) Germination on water in the light of freshly harvested seeds and the chlorophyll content index (CCI) are shown for wild-type Col, the ubc1 ubc2 ubc3 triple mutant, and single and double hub1 and hub2 mutants. For the germination experiment, percentages are means (±sd) of six seed bulks of each three plants. For the chlorophyll content index experiment, percentages are means (±sd) of 15 plants.

