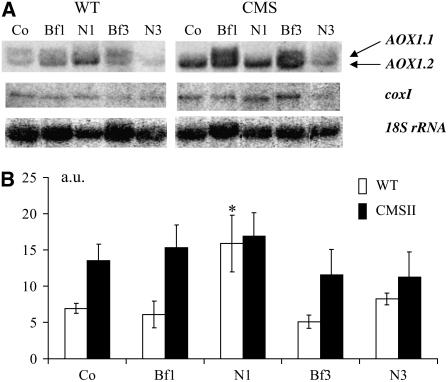
Figure 8.
Transient Changes in AOX1 Transcript Accumulation after Harpin Elicitation.
Harpin or buffer was inoculated as indicated in Figure 5. Samples were harvested at the times indicated after the treatments; total RNA was isolated and run on a 1.3% agarose gel (12 μg per lane). Co, control before elicitation; N, harpin; Bf, buffer.
(A) RNA gel blot analyses using an N. sylvestris AOX1 internal cDNA fragment and coxI sequence as probes; 18S rDNA was used as a loading control. Experiments were repeated three times with similar results, and a typical experiment is shown.
(B) Relative abundance of pooled AOX1.1 and AOX1.2 signals in the wild type and CMSII. RNA gel blot signals were scanned with Scion imaging software. Results are expressed as ratios between AOX1 signal density and 18S rRNA signal density. Wild type, open bars; CMSII, closed bars. In the wild type, the increase in the pooled AOX1 transcripts 1 HAI (N1) compared with the control (Co) is significant (*P < 0.05). Values are the means ± se from seven independent experiments.

