Figure 11.
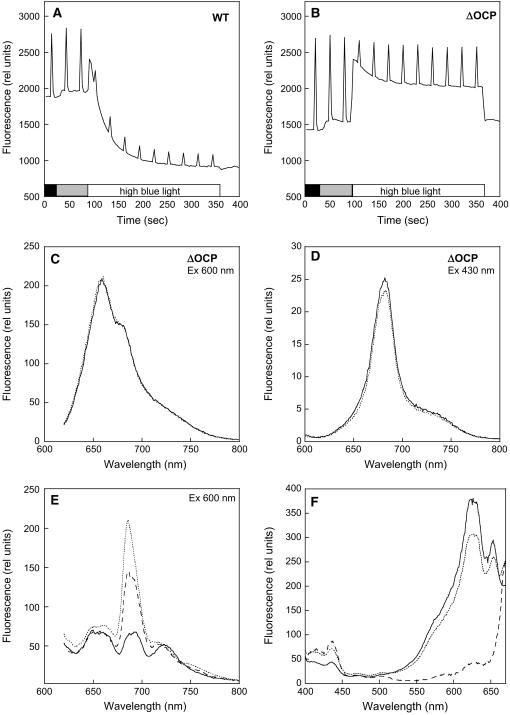
No Blue Light–Induced NPQ in Iron-Stressed ΔOCP Cells.
(A) and (B) Fluorescence changes in iron-starved ΔOCP cells. Dark-adapted 14 d iron-starved wild-type (A) and ΔOCP (B) cells were illuminated successively with low-intensity blue-green light (400 to 550 nm; 80 μmol photons m−2 s−1) and high-intensity blue-green light (740 μmol photons m−2 s−1). Fluorescence yield changes were detected in a PAM fluorometer. The cells were at 3 μg chlorophyll/mL.
(C) and (D) Room temperature fluorescence spectra of ΔOCP cells adapted to low light intensities of blue-green light (solid line) and after 5 min of high intensities of blue-green light illumination (dotted line). Excitation was done at 600 nm (C) and at 430 nm (D).
(E) The 77K fluorescence emission spectra of iron-containing (solid line), 14 d iron-starved (dotted line) wild-type cells, and 14 d iron-starved ΔOCP cells (dashed line). Excitation was done at 600 nm.
(F) The 77K fluorescence excitation spectra of 14 d iron-starved wild-type (solid line) and ΔOCP (dotted line) and PAL cells (dashed line). Emission was monitored at 685 nm. The cells were at 3 μg chlorophyll/mL.

