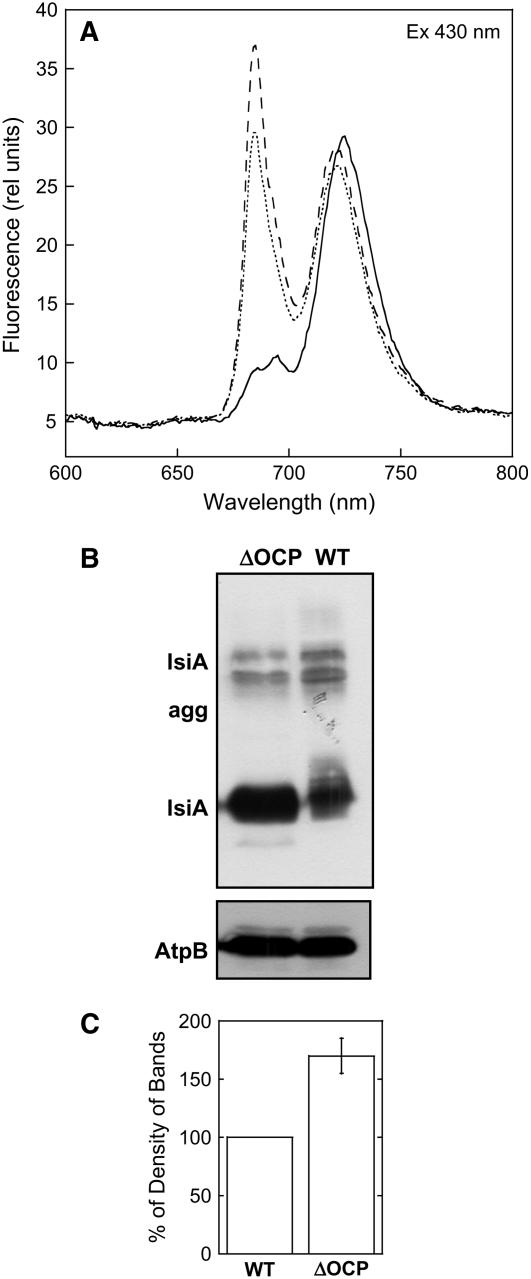
Figure 12.
IsiA Presence in Iron-Starved ΔOCP Cells.
(A) The 77K fluorescence emission spectra of iron-containing (solid line) and 14 d iron-starved (dotted line) wild-type cells and of 14 d iron-starved ΔOCP cells (dashed line). Excitation was done at 430 nm. The cells were at 3 μg chlorophyll/mL.
(B) Immunoblot detection of IsiA of the membrane fraction isolated from 13 d iron-starved ΔOCP (lane 1) and wild-type (lane 2) cells. An antibody against the subunit AtpB of the ATP synthase was used as internal standard (bottom panel). Each sample contained 2 μg of chlorophyll.
(C) Comparative densitometry of IsiA levels in iron-starved wild-type and ΔOCP thylakoids. The results represent the average of three independent experiments. Each error bar shows the maximum and minimum density of band values for each point.

