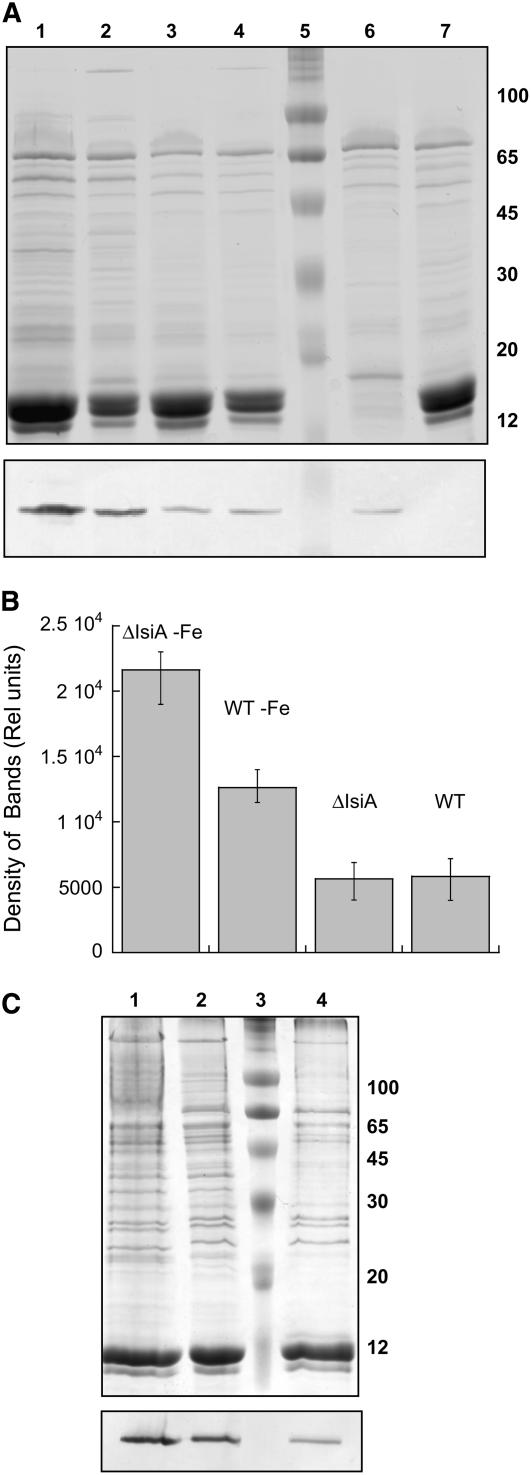
Figure 9.
OCP Detection in Whole Cells and MP Fractions from Nonstarved and Starved Wild Type and Mutants.
(A) Coomassie blue–stained gel electrophoresis and immunoblot detection (bottom panel) of OCP in 12 d iron-starved ΔIsiA (lane 1) and wild-type (lane 2) cells and nonstarved ΔIsiA (lane 3), wild-type (lane 4), PAL (lane 6), and ΔOCP (lane 7) cells. Lane 5 shows molecular mass markers. Each lane contained 1.5 μg of chlorophyll.
(B) Comparative densitometry of OCP bands in nonstarved and iron-starved wild-type and ΔIsiA whole cells. The results represent the average of four independent experiments. Error bars show the maximum and minimum density of band values for each point.
(C) Coomassie blue–stained gel electrophoresis and immunoblot detection (bottom panel) of the OCP in MP fractions isolated from 12 d iron-starved ΔIsiA (lane 1) and wild-type (lane 2) cells and nonstarved wild-type cells (lane 4). Lane 3 shows molecular mass markers. Each lane contained 1 μg of chlorophyll.

