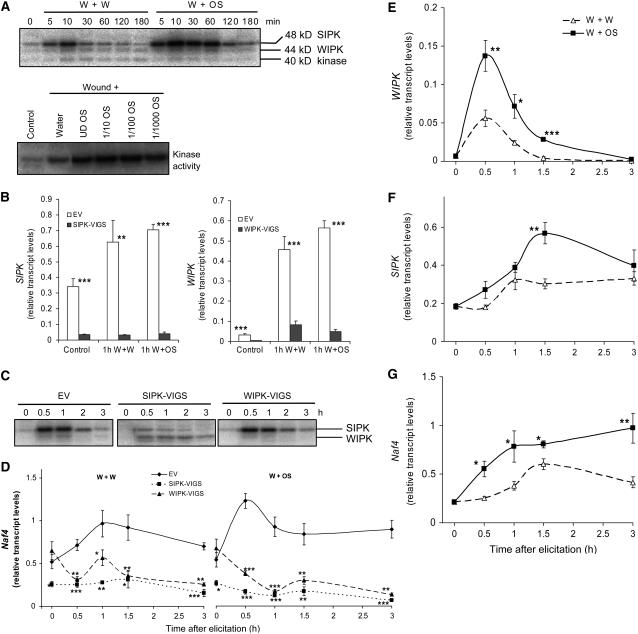
Figure 1.
Applying M. sexta OS to N. attenuata Leaves Activates MAPKs.
(A) Top panel: N. attenuata leaves were wounded with a pattern wheel; 20 μL of water (W+W) or M. sexta OS (1/5-diluted) (W+OS) was applied to the wounds, and leaves from four replicate plants were harvested at the indicated times. Bottom panel: 20 μL of water, undiluted OS (UD OS), 1/10-, 1/100-, and 1/1000-diluted OS was applied to wounds, and leaves from four replicate plants were harvested after 30 min. Kinase activity was analyzed by an in-gel kinase assay using myelin basic protein (MBP) as the substrate.
(B) N. attenuata plants were infiltrated with Agrobacterium carrying pTV00 EV or constructs harboring a fragment of SIPK or WIPK to generate EV, SIPK-VIGS, and WIPK-VIGS plants, respectively. Mean (+se) levels of SIPK and WIPK transcripts in SIPK-VIGS and WIPK-VIGS plants were measured with q-PCR using five replicate untreated (control) and 1 h W+W- and W+OS-treated samples.
(C) EV, SIPK-VIGS, and WIPK-VIGS plants were treated with W+OS and collected at indicated times; five replicate samples were pooled and MAPK activity was detected with an in-gel kinase assay.
(D) Mean transcript levels (±se) of Naf4 in EV, SIPK-VIGS, and WIPK-VIGS plants after W+W and W+OS treatments as measured with q-PCR. Asterisks represent significantly different transcript levels between EV and VIGS plants at the indicated times (n = 5, two-way analysis of variance [ANOVA], Fisher's protected least-square difference (PLSD); *, P < 0.05; **, P < 0.01; ***, P < 0.001).
(E) to (G) Mean transcript levels (±se) of WIPK, SIPK, and Naf4 after W+W and W+OS treatments as measured with q-PCR in wild-type N. attenuata. Asterisks represent significant differences between transcript levels in samples treated with W+OS and W+W at the indicated times (n = 5, unpaired t test; *, P < 0.05; **, P < 0.01; ***, P < 0.001).

