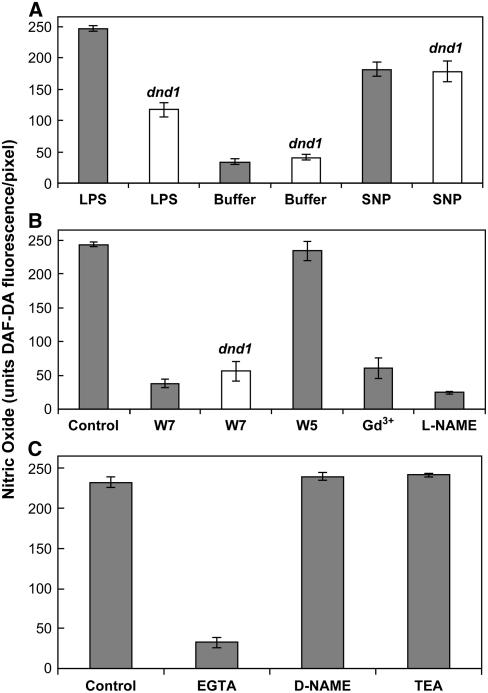
Figure 4.
Quantitative Analysis of in Vivo NO Generation Monitored Using DAF-2DA Fluorescence.
The maximum fluorescence intensity that could be measured was 250 units/pixel (see Methods). Results shown are from three independent experiments. Results in (A) correspond to images shown in Figure 2; (B) and (C) correspond to images shown in Figure 3. In all cases, results are presented as mean (n ≥ 3) fluorescence intensity per pixel (i.e., averaged over the area of a guard cell pair; see Methods) ± se. In all cases, closed bars represent measurements taken on wild-type tissue; open bars denote measurements of epidermal peels prepared from dnd1 plants. The experiment shown in (A) compares fluorescence intensity of wild-type and dnd1 guard cells in reaction buffer alone (Buffer), reaction buffer with 100 μg/mL LPS added, or reaction buffer with 50 μM SNP added. For (B) and (C), all measurements were undertaken with 100 μg/mL LPS in the reaction solution. Measurements taken with LPS alone added to the reaction buffer are denoted as Control; for concentrations of other compounds added to the reaction buffer, see legends of Figures 2 and 3.

