Figure 6.
Morphological Analyses of T161D Plants.
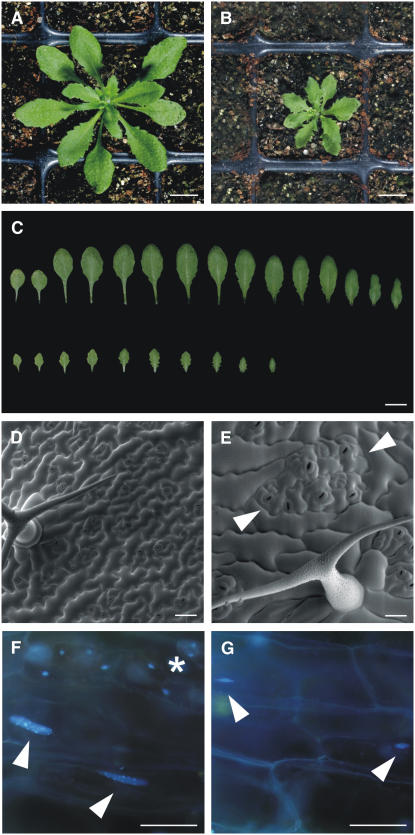
(A) and (B) Wild-type (A) and T161D (B) plants at 3 weeks after germination. T161D plants are reduced in growth.
(C) Comparison of wild-type (top row) and T161D (bottom row) leaves from 3-week-old plants. T161D plants have fewer leaves that are smaller and strongly serrated.
(D) and (E) Scanning electron micrographs.
(D) Typical leaf surface of wild-type plants with equally distributed stomata cells and a three-branched trichome.
(E) Epidermis of T161D leaves display larger epidermal pavement cells that surround islands of stomata lineage cells (marked by arrowheads). Trichomes are reduced in branching, here showing a two-branched trichome.
(F) and (G) Fluorescence micrographs of DAPI-stained leaves.
(F) Wild-type leaf of the same age as in (E) stained with DAPI. Two nuclei of the large cells overlying the midvein are indicated by arrowheads. For comparison, a stomata cell with a DNA content of 2C is marked by an asterisk.
(G) The DNA amount of nuclei in T161D plants is reduced dramatically, and midvein overlying cells contain very small nuclei, highlighted with arrowheads.
Bars = 1 cm in (A) to (C) and 50 μm in (D) to (G).

