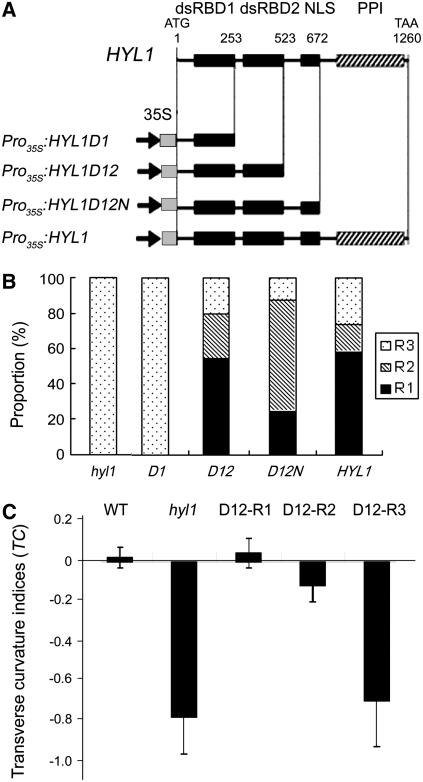
Figure 1.
HYL1 Constructs and Phenotypes of the Transgenic Plants.
(A) Diagrams of the deletion mutants of the HYL1 gene and the featured domains of the HYL1 protein. The locations of the four conserved domains (dsRBD1, dsRBD2, NLS, and PPI) are indicated by squares (at top). The positions of the first and last nucleotides in the deletion mutants are numbered from the initial ATG (above HYL1 protein diagram). The constructs Pro35S:HYL1D1, Pro35S:HYL1D12, Pro35S:HYL1D12N, and Pro35S:HYL1 are shown.
(B) Proportion of rescued plants within the T1 population. D1, D12, D12N, and HYL1 are four T1 populations of hyl1 plants transformed with Pro35S:HYL1D1, Pro35S:HYL1D12, Pro35S:HYL1D12N, and Pro35S:HYL1, respectively. R1 indicates plants that were completely rescued, R2 indicates plants that were strongly rescued, and R3 indicates weakly rescued plants. The number of transformants analyzed was 28 to 58 for each segregating population.
(C) Transverse curvature indices of the rescued plants. The fourth leaves of 25-d-old plants were cut transversely at the widest extreme and pressed on the desk for measurement of pressed width (pw) when the distance between the lateral margins (lm) of the leaves at the widest extreme was measured. The transverse curvature index (TC) is calculated with the formulae TCu = (lm − pw)/pw and TCd = (pw − lm)/pw. Error bars represent the sd of >20 seedlings.

