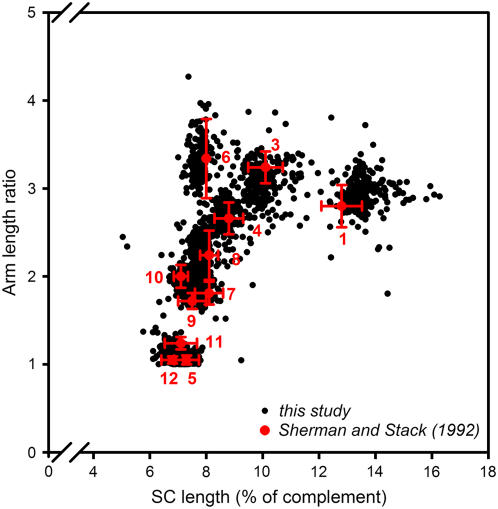
Figure 5.
SC Length versus Arm Length Ratio in Spread Tomato PMCs.
The black dots represent the results from 200 PMC nuclei of which the complete set of 12 SCs could be analyzed by immunofluorescence labeling (this study), with each dot representing an individual SC. The red symbols and numbers refer to data from Sherman and Stack (1992). The red dots represent the average SC length versus the average arm length ratio of chromosomes 1 to 12 (except chromosome 2), as identified by ultrastructural analysis of spread PMCs from trisomic tomato plants (red numbers). The red error bars represent 1 sd, in both directions, of the SC lengths and arm length ratios as determined by Sherman and Stack (1992). Chromosome 2 is not represented in this figure because its arm length ratio cannot be determined reliably: the AEs of its short arms stay asynapsed and are often broken. However, because of these features, SC 2 is easily identified. The SC length is expressed as a percentage of the total SC complement length (excluding the short arms of SC 2) of the relevant PMC nucleus to account for variation in length in individual PMCs (e.g., due to variation in spreading conditions).

