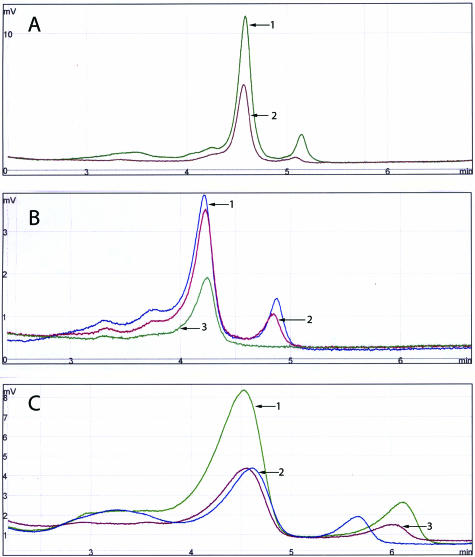
Figure 2.
DHPLC analyses of 271-bp (A), 234-bp (B), and 129-bp (C) PCR products amplified from GISTs 1, 2, and 3. Left and right peaks represent products amplified from WT and mutant KIT alleles, respectively. A: Note the presence of WT and mutant KIT peaks in case 1, no indication of mutation (one WT peak) in case 2, and the lack of PCR amplification products in case 3. B: Note the presence of WT and mutant KIT peaks in case 1 and 2 and no indication of mutation (one WT peak) in case 3. C: Note the presence of WT and mutant KIT peaks in all three cases.

