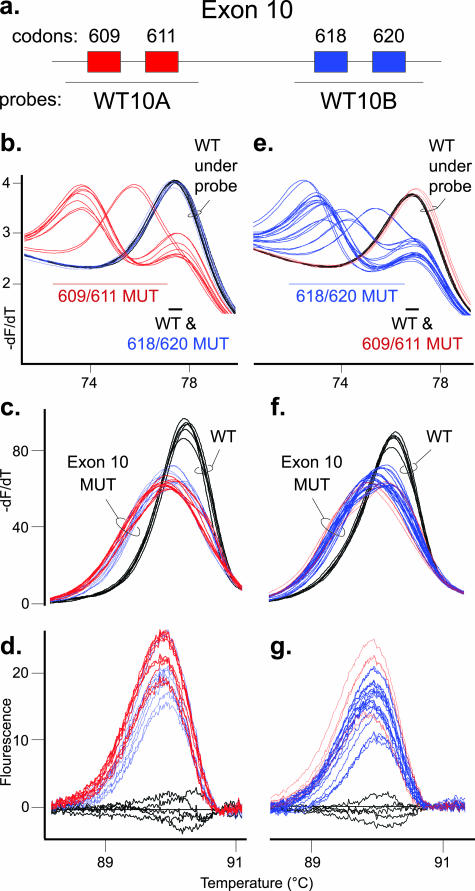
Figure 1.
Primary assay for detection of sequence variation in RET exon 10. a: Diagram of RET exon 10 with codons 609 and 611 boxed in red and codons 618 and 620 boxed in blue. The primary assay for exon 10 used two unlabeled probes of WT sequence. As displayed, the WT10A probe detects codon 609 and 611 mutations, whereas the WT10B probe detects codon 618 and 620 mutations. In each graph, three wild-type controls in duplicate (WT, black traces) are shown with two codon 609 and three codon 611 mutant samples in duplicate (red traces) as well as five codon 618 and five codon 620 mutations (blue traces). The three left panels are unlabeled probe and amplicon high-resolution melting data from the WT10A probe reaction, and the three right panels are data from the WT10B probe reaction. For each probe, thick trace lines were used with mutations detected by the probe data, and thin trace lines were used with mutations detected by amplicon data only. b: Derivative melting curve plot for the WT10A probe data. The alleles are divided into two Tm ranges, and predicted codon mutant alleles in each range (609/611 MUT or 618/620 MUT), along with the WT allele, are listed. c: Amplicon derivative melting curve data from the WT10A probe primary assay with the WT and exon 10 mutation (exon 10 MUT) samples labeled. d: Difference plot of same amplicon data. e: Derivative melting curve plot for the WT10B probe data. The alleles are divided into two Tm ranges, and predicted codon mutant alleles in each range, along with the wild-type allele, are listed. f: Amplicon derivative melting curve data from the WT10B probe primary assay with wild-type and exon 10 mutant samples labeled. g: Difference plot of same amplicon data.

