
Fig. 3.
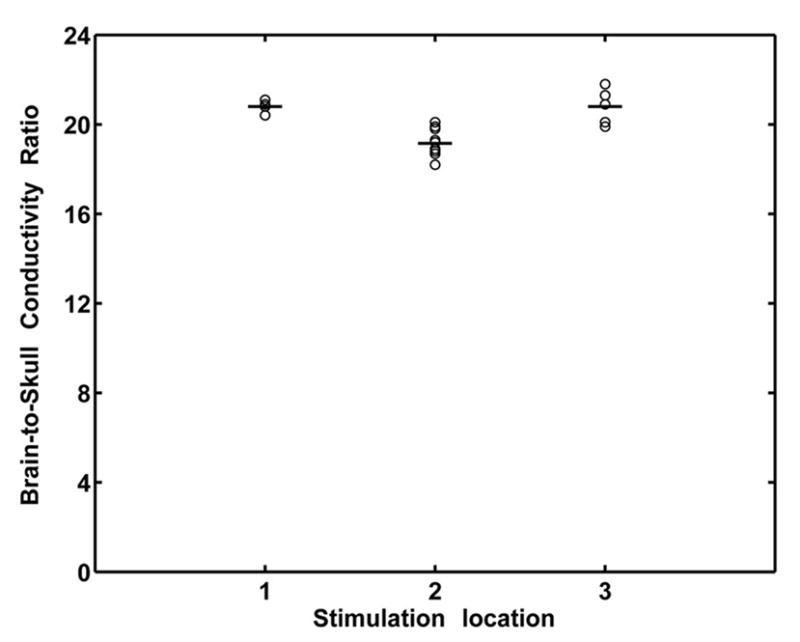
Estimated brain-to-skull conductivity ratio in subject #2, at various stimulating locations with various strength of current injection. See caption of Fig. 2 for notation. Stimulation locations 1 through 3 refer to the stimulating electrode pairs: 1: PAR36-37; 2: PAR43-44; 3: PAR46-47. The stimulation strength ranges from 4 mA to 9 mA. Note that the mean and standard deviation of the brain-to-skull conductivity ratio values is 19.9±1.0 in this subject.