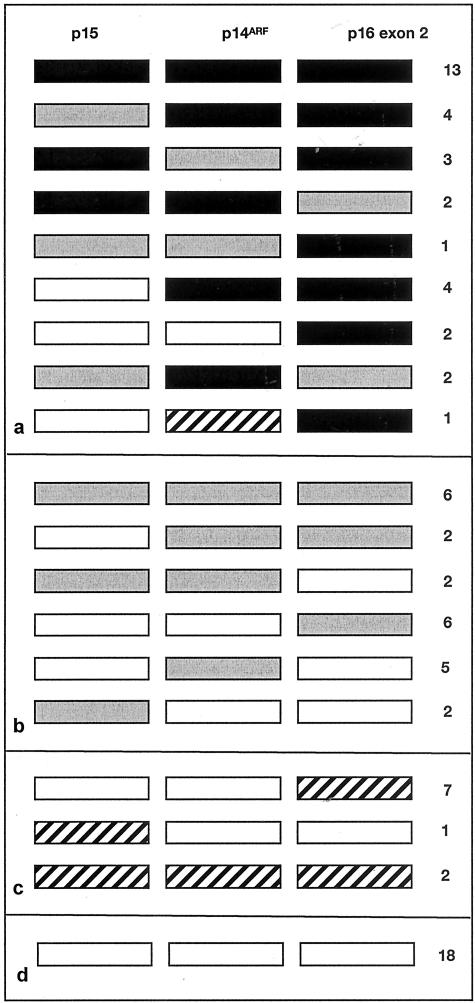
Figure 4.
Pattern of DNA copy number changes in primary bladder tumors. Gene dosage ratios were calculated relative to PFKL. ▪, homozygous deletion; ░⃞, under-representation of 9p21 gene; ▨, over-representation of 9p21 gene; □, no copy number change. Patterns of deletion are shown for 32 tumors with homozygous deletion of one or more genes (a), 23 tumors with under-representation of one or more genes (b), 10 tumors with over-representation of one or more genes (c), 18 tumors with no copy number change (d).

