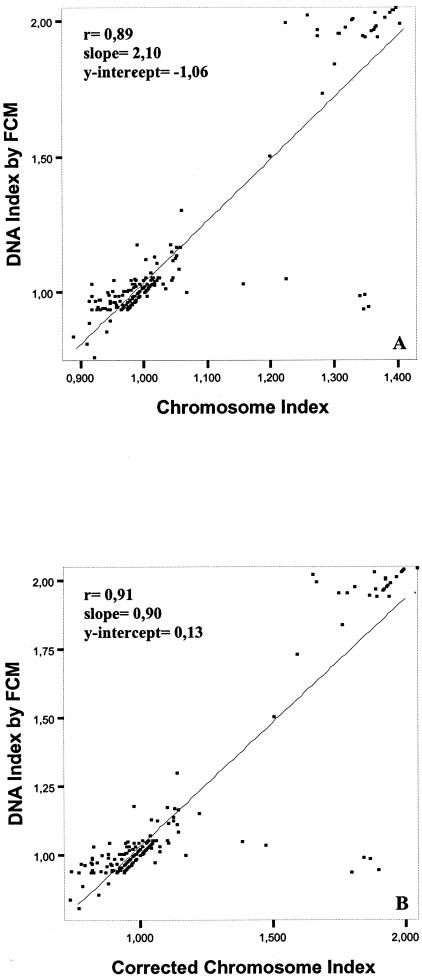
Figure 3.
Meningioma tumors (n = 125): correlation between the DNA index obtained by flow cytometry (FCM) and both the uncorrected (A) and corrected (B) chromosome indices obtained for each tumor cell clone according to the numerical chromosome abnormalities detected by interphase FISH analysis of 12 different chromosome probes.

