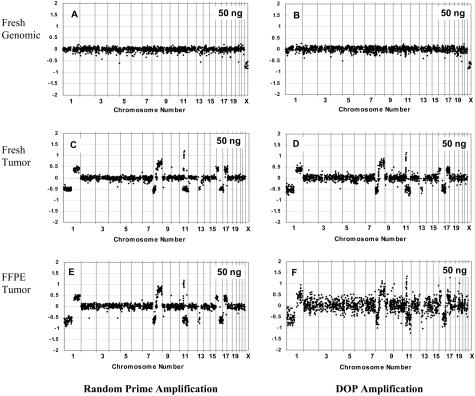
Figure 2.
Array CGH using random prime (A, C, E) versus DOP (B, D, F) amplification with 50 ng of input DNA. Normal genomic male versus female DNA is shown in A and B, whereas DNA from a fresh-frozen breast tumor versus female reference is shown in C and D, and results from the same tumor that was formalin-fixed and paraffin-embedded is shown in E and F. Log2 ratios for each BAC are plotted according to chromosome position.

