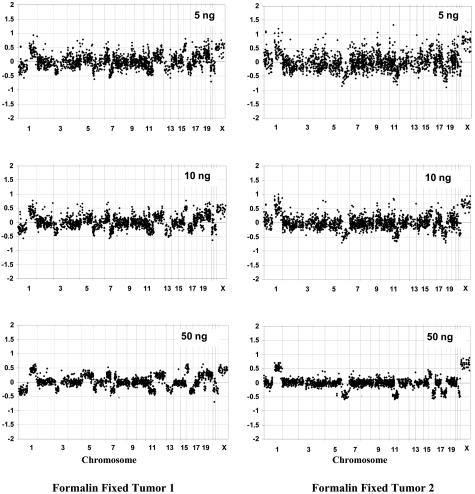
Figure 3.
Array CGH plots using 5 ng, 10 ng, and 50 ng of DNA from two different paraffin-embedded breast tumors versus normal male reference as input DNA. DNA was random prime amplified, labeled, and hybridized as described in Materials and Methods. Log2 ratios for each BAC are plotted according to chromosome position. Note the decreasing scatter with increased starting DNA. However, even lower DNA inputs still show changes within chromosome 1, 6, 11, 16, 18, and 22.

