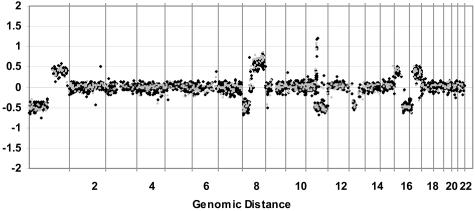
Figure 6.
Comparison of total genomic array CGH using DNA from a fresh-frozen versus FFPE breast tumor. Fresh tumor (black squares) and FFPE tumor (gray squares) show close agreement. DNA labeled as in Figure 4. Log2 ratio for each BAC is plotted according to chromosome position. Note the similar levels of high-level amplification on 11q for both samples.

