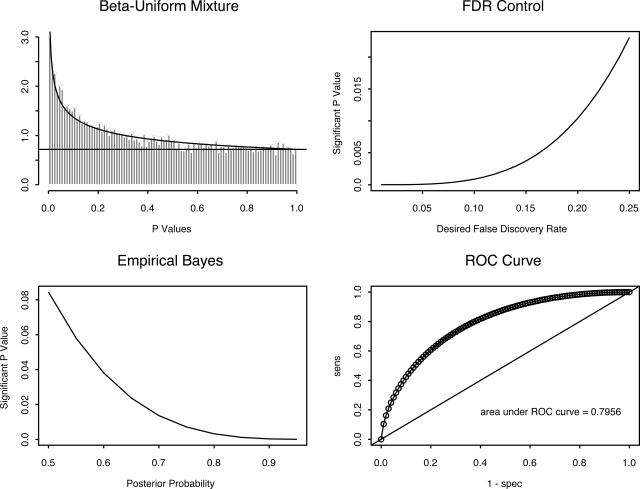
Figure 2.
Analysis of the P values arising from 16,733 t-tests as a β-uniform mixture. Top left: Histogram of the observed P values, with overlaid curves representing the division into uniform and β contributions. Top right: Relationship between cutoff for P values and the false discovery rate. Bottom left: Relation between cutoff for P values and the posterior probability of differential expression. Bottom right: Receiver operating characteristics curve associated with selecting different P value cutoffs.

