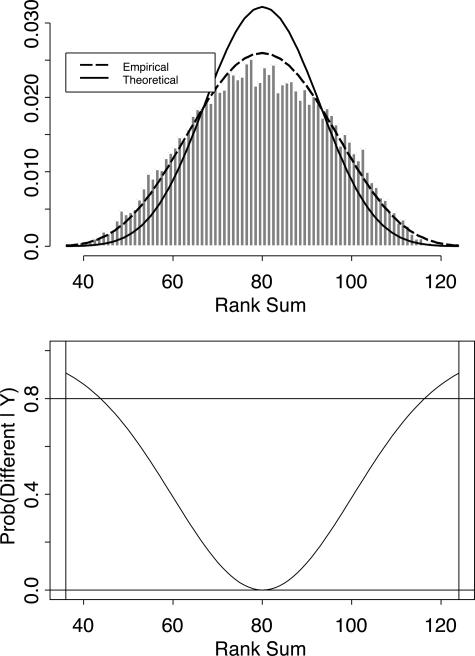
Figure 3.
Analysis of the Wilcoxon rank-sum statistics of 16,733 probe sets using an empirical Bayes method. Top: Histogram of the empirically observed distribution of rank-sum statistics, with an overlaid curve representing the theoretical distribution. Bottom: Posterior probability that an observed rank sum represents a differentially expressed gene.

