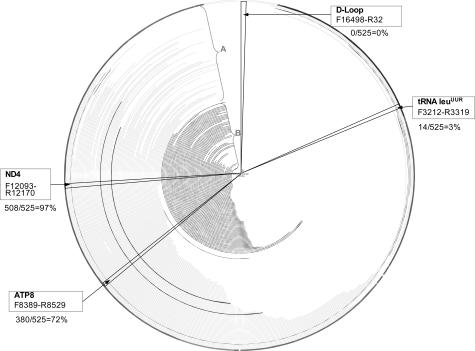
Figure 1.
Location of mtDNA probes for the real-time qPCR analysis of mtDNA deletion and depletion. The first nucleotide is at the 12 o’clock position. Clockwise are tRNA leuUUR, ATP8, ND4, and D-Loop. The arcs in the circle represent the deleted regions in reported cases, from the starting nucleotide position (np) of the deletion to the ending np of the deletion, based on mitomap database (http://www.mitomap.org, accessed on March 8, 2003). A: Reported large-scale [≥264 bp] single deletions. B: Reported multiple deletions. The two bolded arcs in A represent the two most common large-scale single deletions reported.

