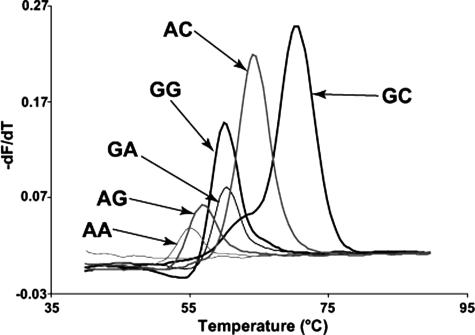
Figure 2.
HPA 6 melting curves from the HybProbe assay performed on the LightCycler. There are six melting curves shown, each representing a homozygous genotype at HPA 6 (nucleotide 1544) and the adjacent 3′ nucleotide (nucleotide 1545). The genotype of each curve is labeled with an arrow. The thin gray line without an arrow on each graph represents the no template control for each reaction. The first letter is the nucleotide at position 1544; the second letter is the nucleotide at position 1545.

