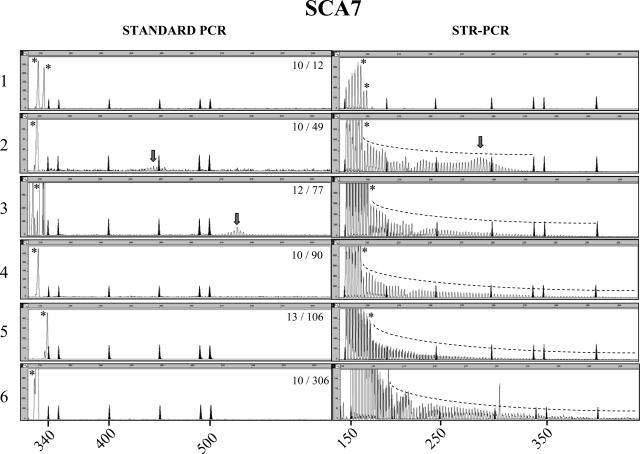
Figure 2.
Comparison between standard PCR and STR-primed PCR analysis in the SCA7 locus. Left and right panels represent the analysis of SCA7 CAG repeat in the same subject using standard PCR and STR-primed PCR, respectively. The genotype of the SCA7 CAG triplets is shown in the left panels. The STR-primed PCR peak profile of a healthy control with two alleles in the normal size range (panel 1) is distinct from the profiles in a subject carrying pathogenic 49 and 77 CAG repeats (panels 2 and 3). In patients carrying >80 CAG repeats, standard PCR often failed to amplify the repeat, whereas STR-primed PCR always detected the pathogenic allele (panels 4–6). Marker peaks are shadowed. Their sizes on the left panels are 340, 350, 400, 450, 490, and 500 bp. Marker sizes on the right panels are 160, 200, 250, 300, 340, 350, and 400 bp. Size in base pairs is also indicated on the abscissa, whereas ordinate shows fluorescence intensity in arbitrary units. An asterisk indicates the peaks corresponding to the normal alleles. The arrow points to the central peak of visible expansions.

