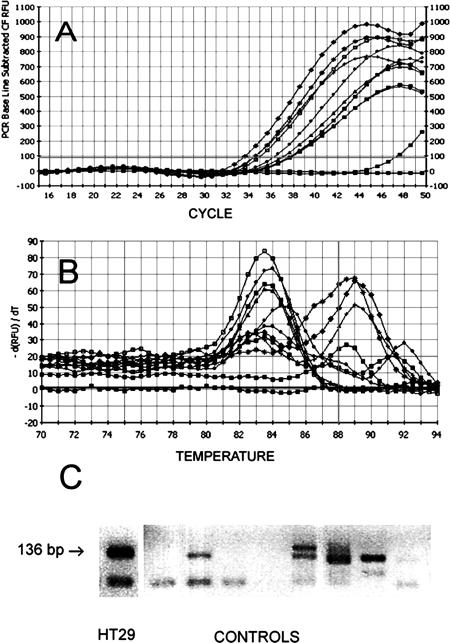
Figure 3.
Nonspecific amplifications by conventional intron spanning primers. Amplification plots obtained with cDNA of lympho-monocytes from healthy donors (A); melting curves obtained from the same PCR reactions (B); gel electrophoresis analysis (2% agarose gel stained with ethidium bromide) of amplified material from lympho-monocytes from healthy donors (controls) and HT29 cells (C).

