Figure 2.
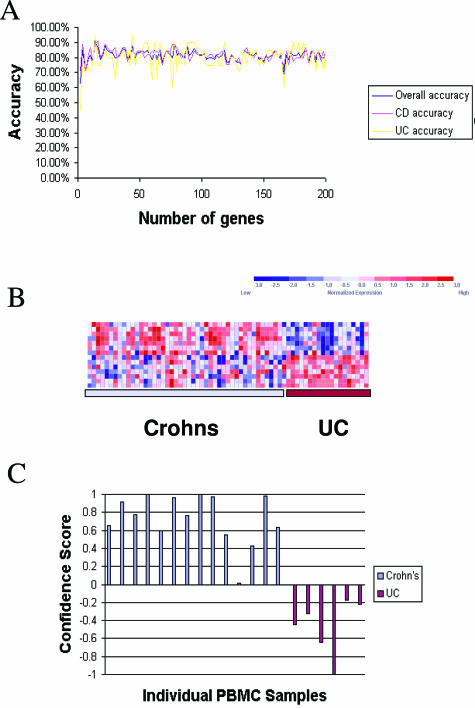
Supervised class prediction of CD and UC using PBMC profiles. A: The relative overall accuracy, accuracy of CD classification, and accuracy of UC classification for gene classifiers of increasing size are presented. The smallest predictive model with the highest accuracy (94%) on LOOCV was a classifier composed of 14 gene sequences. B: Expression levels for the 14 most class-correlated sequences (rows) are indicated for each of the patients in the training set (columns). Expression data for each gene across the entire data set were normalized to a mean of zero and a variance of one and relative expression is indicated according to the color scale of blue (low expression) to red (high expression) as indicated in the key. C: Results of weighted voting class assignment in the test set of samples. Confidence scores in favor of CD are presented as positive values, and confidence scores of the class assignments in favor of UC are presented as negative values. The overall accuracy of class assignment was 100% in the test set, in which 15 of 15 Crohn’s patients were correctly classified as Crohn’s, and 6 of 6 UC patients were correctly classified as UC, based solely on expression patterns in PBMCs. The actual origins of the PBMC profiles are indicated by color (CD patients, light blue; UC patients, maroon).

