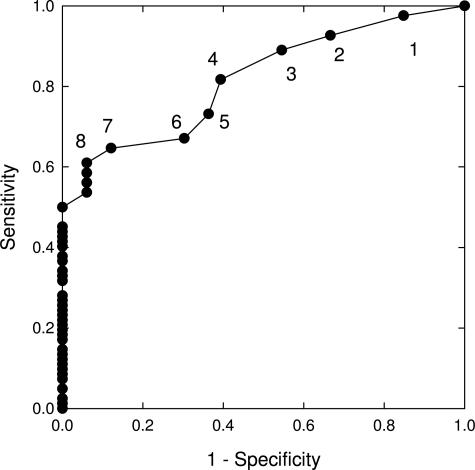
Figure 3.
ROC curve of 9p21 loss for the detection of low-grade dysplasia relative to normal squamous epithelium. The filled circles along the curve represent the sensitivity and specificity for low-grade dysplasia that would be obtained in this cohort of patients using different cutoffs. The numbers shown at each point along the curve refer to the percentage of cells that would have to exhibit 9p21 loss for a specimen to be considered positive for low-grade dysplasia.

