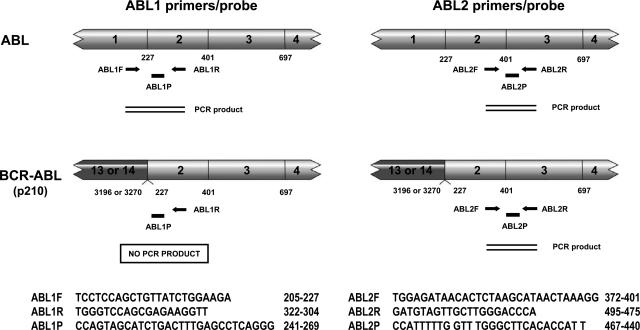
Figure 1.
Schematic diagram of the two different sets of primers/probes for ABL quantification (left, ABL1; right, ABL2). Lightly shaded boxes represent ABL cDNA and darkly shaded boxes represent BCR cDNA with exons indicated. Numbers below cDNAs indicate nucleotide positions at exon boundaries. Arrows represent PCR primers and their relative positions to ABL and BCR-ABL cDNAs. Black bars represent the TaqMan probes and their positions. Sequences of primers and probes and their locations are shown under each diagram.

