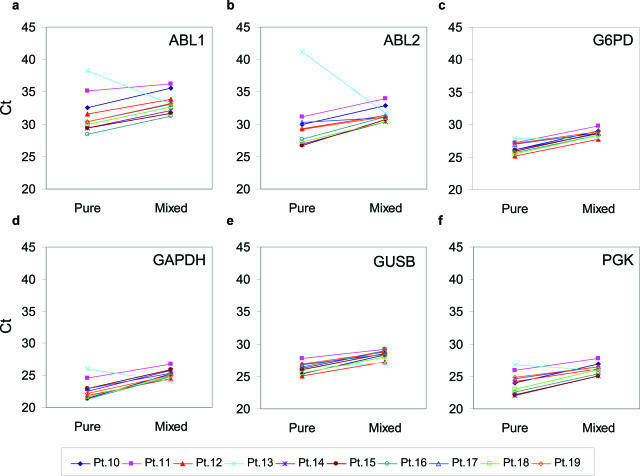
Figure 3.
Threshold cycle difference of six internal control genes in 10 pairs of pure patient samples and mixed samples. cDNA from 10 patient specimens (Table 1, patients 10 to 19) were mixed with cDNA from normal peripheral blood mononuclear cells at 1:16 ratio. Levels of six different control genes as indicated in the graphs were determined in the 10 pairs of pure and mixed samples. Mean Ct values of triplicate real-time PCR reactions were plotted. Lines connect pure and mixed patient samples to show pairwised relationship.

