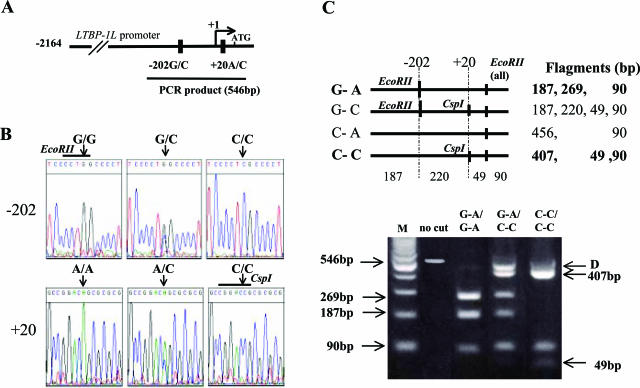
Figure 1.
Screening for the LTBP-1L genotypes. A: Schematic representation of the two novel SNPs in the LTBP-1L promoter. The transcriptional start site is indicated as +1. B: Representative results of nucleotide sequence analysis. Arrows indicate the location of SNPs. Restriction enzymes used in PCR-restriction fragment length polymorphism (RFLP) analysis are indicated above the sequences. C: Representative results of PCR-RFLP analysis. Numbers in parentheses are the size of each fragment (bp). Arrow D indicates the heteroduplex complexes produced by mismatched annealing of heterogeneous alleles (see Materials and Methods). M, 100-bp DNA ladder marker.

