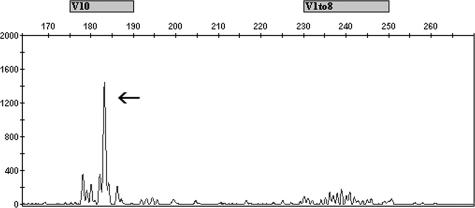
Figure 2.
Electropherogram of PCR for TCRγ rearrangements. The x axis indicates DNA length in nucleotides. The y axis indicates relative fluorescence units. Shown is electrophoresis of products from one multiplex tube, which contains primers to amplify Vγ1-8 and/or Vγ10 rearrangements, with expected product sizes above the x axis. The case was interpreted as positive with a clonal peak detected by Vγ10 primers (arrow) and polyclonal signals detected by Vγ1-8 primers.

