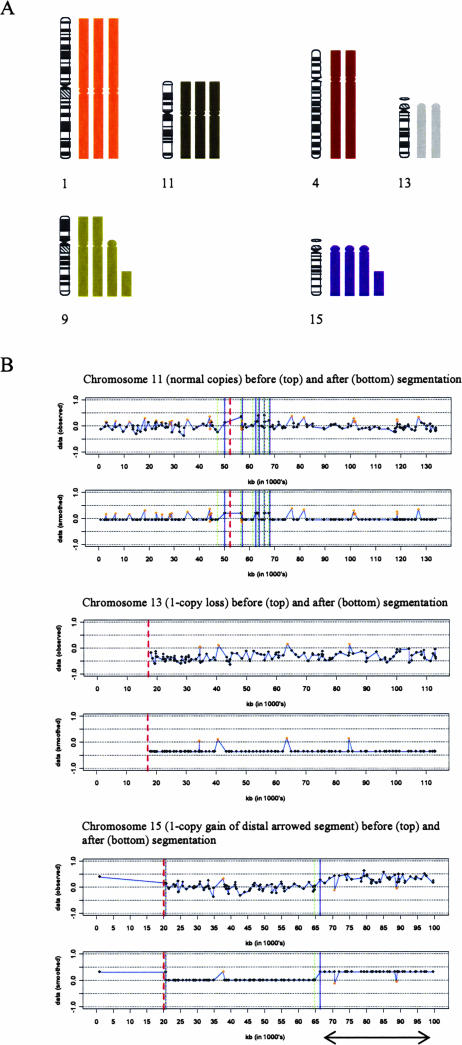
Figure 1.
Selection and segmentation of chromosomal regions showing SCAs. A: Selection of chromosome segments with SCAs in cell line SiHa. Karyogram of chromosomes 1 and 11 (normal copies), 4 and 13 (1-copy losses), and 9 and 15 (1-copy gains), as seen in the majority of metaphases in the triploid cell line SiHa. B: Ratio profiles before and after segmentation, performed using a hidden Markov model-based method and implemented in the R statistical language. Profiles for chromosomes 11, 13, and 15 are shown. The arrowed distal segment of chromosome 15 indicates the region from which clones with 1-copy gains were selected. The orange dots indicate focal aberrations representing true narrow copy changes, mismapped clones, or natural copy number polymorphisms. These aberrations need to be investigated further using alternative techniques and were therefore excluded from analysis. Red dashed line, centromere; green and blue lines, start and end of state transitions, respectively.

