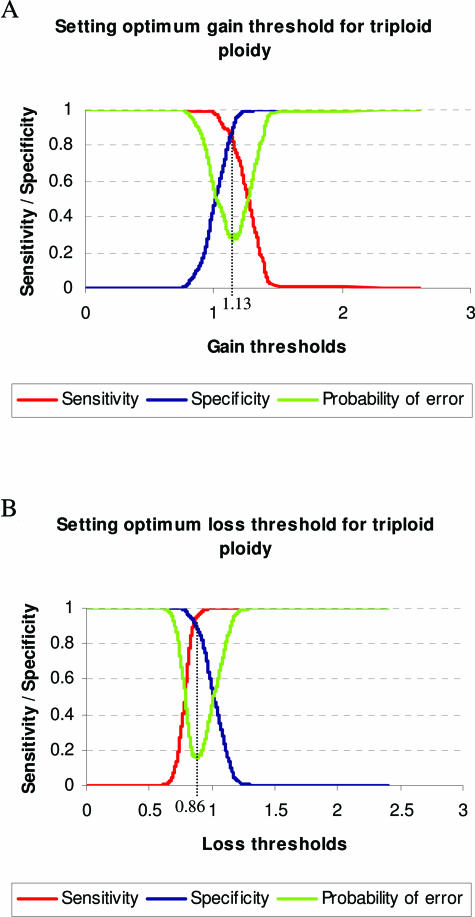
Figure 3.
Plots of array CGH sensitivity and specificity versus the range of gain and loss thresholds for triploid cell lines. The optimum threshold is obtained from the crossing point of the sensitivity and specificity graphs, where the probability of error is minimized. Dotted lines show the locations of optimized gain (A) and loss (B) thresholds for triploid cell lines.

