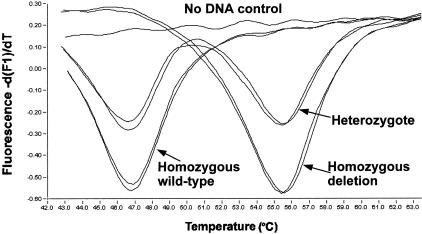
Figure 2.
Graph of -d(F1)/dT versus temperature showing the melting troughs that reveal the genotype. The direction of change in fluorescence intensity when the quenched probe dissociates from the amplicon (increase) is the opposite of that seen when using a dual probe fluorescence resonance energy transfer system to generate the fluorescent signal.14 For this reason we see a trough, or inverted peak, when using the software on the Roche LightCycler. The figure shows results for two template DNAs that are homozygous wild-type, two that are homozygous mutant, two heterozygotes, and one no template control.

