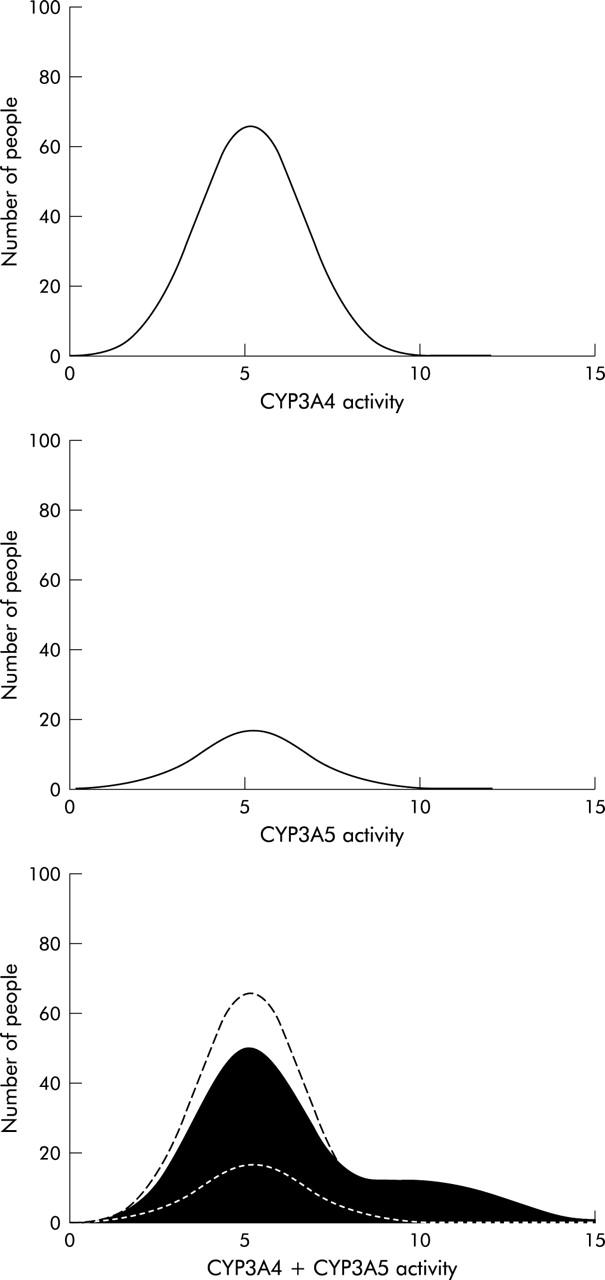
Figure 3 .

The cytochromes P450 CYP3A4 and CYP3A5 genetic polymorphism. The top panel depicts the distribution of CYP3A4 activity in the white population, assuming that 100% of individuals express CYP3A4, with a 10-fold range of activity in the population. The middle panel depicts CYP3A5 expression, assuming that 25% of the white population express 3A5, with a 10-fold range of activity. The bottom panel depicts the CYP3A4 and CYP3A5 distributions (dashed lines) and the composite distribution for drugs metabolised equally well by both enzymes.
