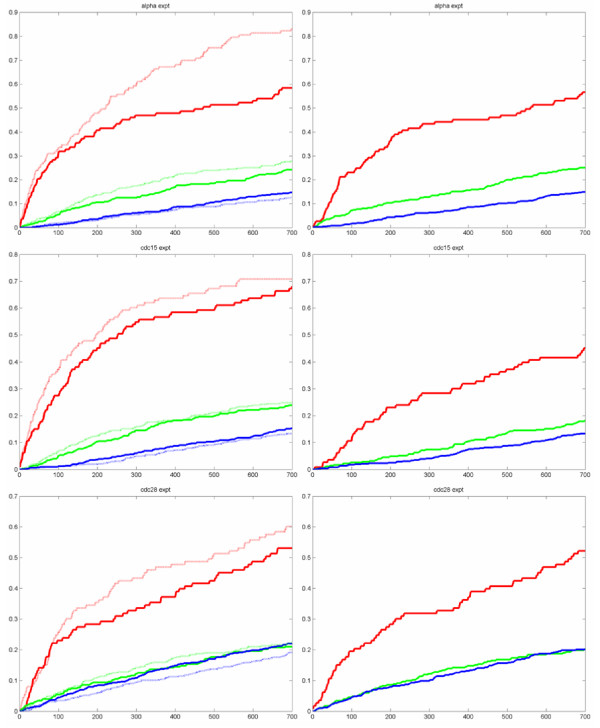
Figure 12.
Comparison of coverage as a function of gene rank between results of [28] and our method. Left column: results of [28] on the benchmark sets B1, B2, and B3 when only periodicity is considered (solid lines), and when periodicity and regulation strength are both considered (dotted lines). Right column: results of our method on the benchmark sets B1, B2, and B3. Red line is for B1, green line is for B2, blue line is for B3. X-axis is the fraction of set identified, y-axis is the number of genes identified.

