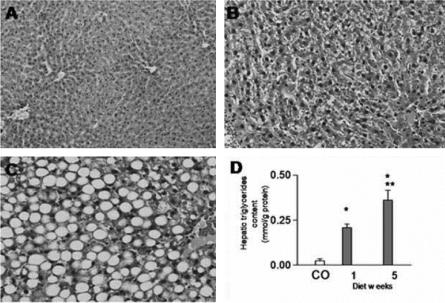
FIGURE 1. Micrograph of liver tissue of control rat (A) showing no pathologic changes. After a 1-week MCD diet (B), mainly microvesicular steatosis with occasional macrovesicular foci and no inflammatory cells were observed. After 5 weeks of MCD diet (C), mainly macrovesicular steatosis and prominent inflammation were observed. All slides stained with hematoxylin and eosin (original magnification ×20). The histopathologic changes corresponded with increased hepatic triglycerides content (D). Values are mean ± SEM. *P < 0.05 versus controls. **P < 0.05 versus the mild steatosis group.

An official website of the United States government
Here's how you know
Official websites use .gov
A
.gov website belongs to an official
government organization in the United States.
Secure .gov websites use HTTPS
A lock (
) or https:// means you've safely
connected to the .gov website. Share sensitive
information only on official, secure websites.
